Nature isn't straight

As hurricane Ike is coming closer to my house than I'd like, I've been watching the predicted path maps on the National Weather Service's homepage. What bugs me is that there are straight lines between all the points. How silly is that? Nature never moves in straight lines, so I had to make my own map.

Hurricane Ike map with spiro prediction

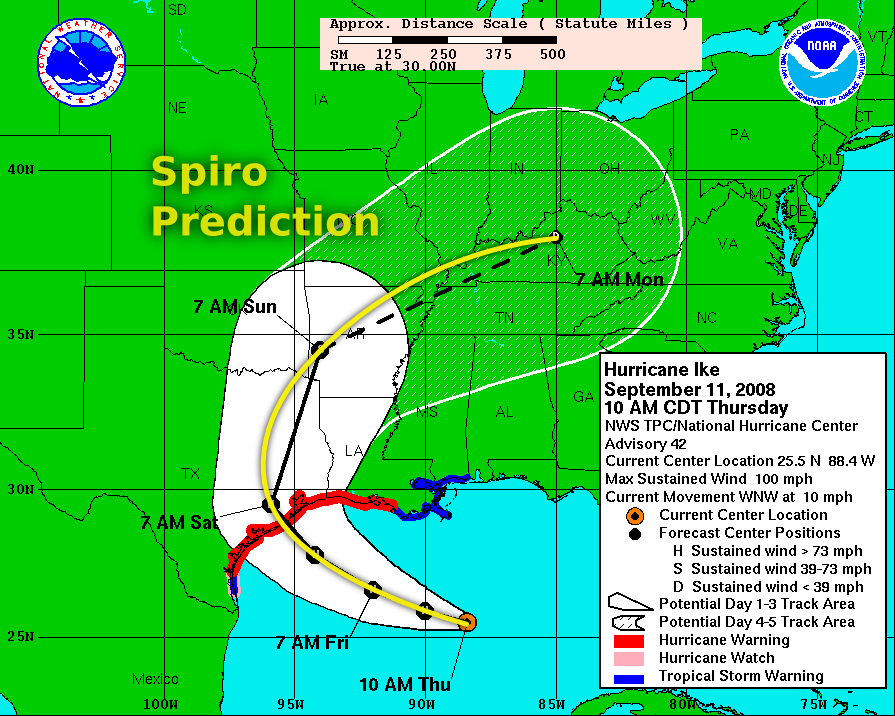
What I did was take the map and then place a path over it using the spiro splines live path effect in Inkscape. Spiro splines are amazingly natural, and so I figured they'd work very well here also. I like the results, and it seems just from looking at it, to make more sense as a path for the hurricane. Perhaps they should use Inkscape at the National Weather Center?

posted on Thu, 11 Sep 2008 at 14:10 | permanent link | 5 Comments

Posted by http://perroazul.pip.verisignlabs.com/ at Thu Sep 11 14:39:15 2008
wow! 
what matters about those projected paths are the black dots which are result of some mathematical simulation. The straight lines are there just to give a sense of continuity and you could use whatever you want to join those black points( because nobody knows what happens in between). it makes as much sense to use straight lines, quadratic interpolation, cubic splines, etc. because all of those are equally false!

Posted by David Tomaschik at Thu Sep 11 15:16:15 2008
Well really, the same computer model that gives the dots could give a track of the in-between just by performing the same simulation for all intermediate time values.  They just choose certain intervals because the further away, the less accurate the model.

Posted by http://perroazul.pip.verisignlabs.com/ at Thu Sep 11 16:00:46 2008
@david: yes, you could. but it is not that easy. Those stupidly large simulations are carried in super computers (clusters with hundreds of processors) and if you were to include enough points to produce a continuous looking line, the results would be ready days after the storms have passed. to give you an example:
"Current operational weather forecasts for North America are based on a grid with a horizontal resolution of approximately 12 kilometers, while the highest-resolution ensemble forecasts produced by NCEP use an average resolution of 40 kilometers. Only the net effect of thunderstorms can be represented at those resolutions"
taken from http://www.siam.org/news/news.php?id=1402

Posted by Matthew at Thu Sep 11 22:41:20 2008
I asked NOAA a while back about using proper capitalization in their text updates instead of all caps.  They said they couldn't do it.  So how dare you expect curvy lines ;-)

Posted by Jeremy at Fri Sep 12 00:20:59 2008
So when using spiro splines, does the hurricane get closer or further from your house?

Name:


OpenID:


Comment: