Usually in my presentations about Inkscape, I have a slide about the math behind a Bezier curve. I do it for a couple reasons: I think it is an interesting set of equations; otherwise someone asks me. Typically I put up the basic math, let's take a look at it:
|
x(t) = axt3 + bxt2 + cxt + x0 cx = 3 (x1 - x0) y(t) = ayt3 + byt2 + cyt + y0 cy = 3 (y1 - y0) |
| Math link |
The curve is usually expressed as a parametric equation, with a lot of nice symmetry. I usually like to talk about how as you move from t being zero to one you decrease the effect of x0 and increase the effect of x3. This is caused by all the powers of t, and the fact that there is a single x0 without one. Mentally, I think about the equation like this (done with x to save space, y is the same):
|
x(t) = m0x0 + m1x1 + m2x2 + m3x3 m0 = -t3 + 3t2 - 3t + 1 |
While it is obvious for the line to pass through x0 and x3 that at t = 0 you want m0 equal to one and the rest of the m's equal to zero. And, then at t = 1 you want the opposite where m3 is now equal to one and the rest are zero. I think it is also reasonable to see from rearranging the equations like this that you want the sum of m0, m1, m2 and m3 to be equal to one (though I can't find a mathematical reason for that, I think it is more a stability thing).
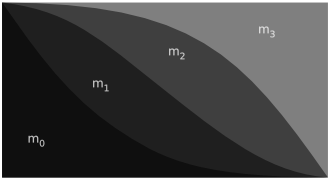
As we start to look at the equations here, we get a feel how moving through t from zero to one we're changing the effect of the different points in the Bezier curve. This is where I think a handy graph comes in. This is is a graph of coefficients m0-3 as you move through from t equal to zero all the way to one.

I think that the graph gives you a good feeling of how the influence on the final line changes as you move through values of t. Starting from zero at the left hand size you can see where the value is made up entirely of x0. In the middle you can see why the line rarely crosses through x1 and x2, really only by happenstance. Lastly, the curve becomes all x3.
I hope that helps you get a better feeling for how a Bezier curve works. Of course, implementing them well is a touch more complex. But, that's a topic for a different day.
posted Jan 30, 2006 | permanent link